How CMOs Measure Activations with QR Codes on Branded Cans
Activations are easy to love and hard to measure. QR on branded cans gives CMOs a physical object guests hold and a digital door they control.
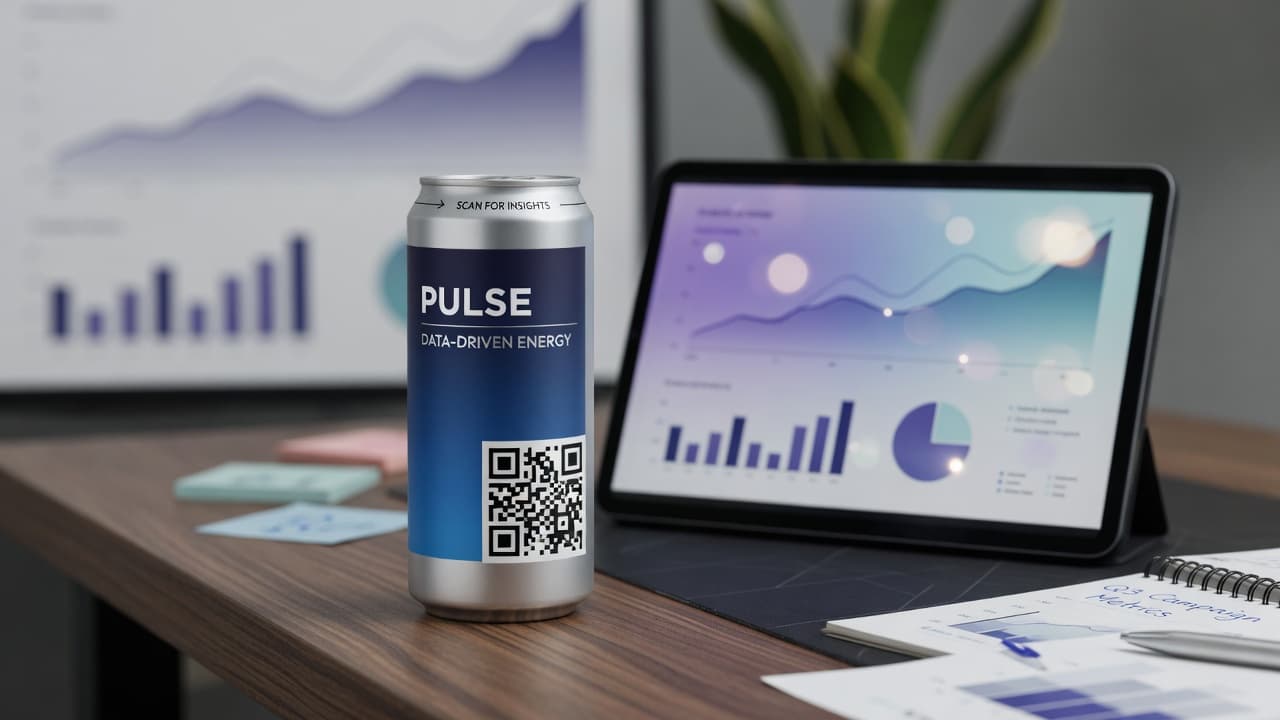
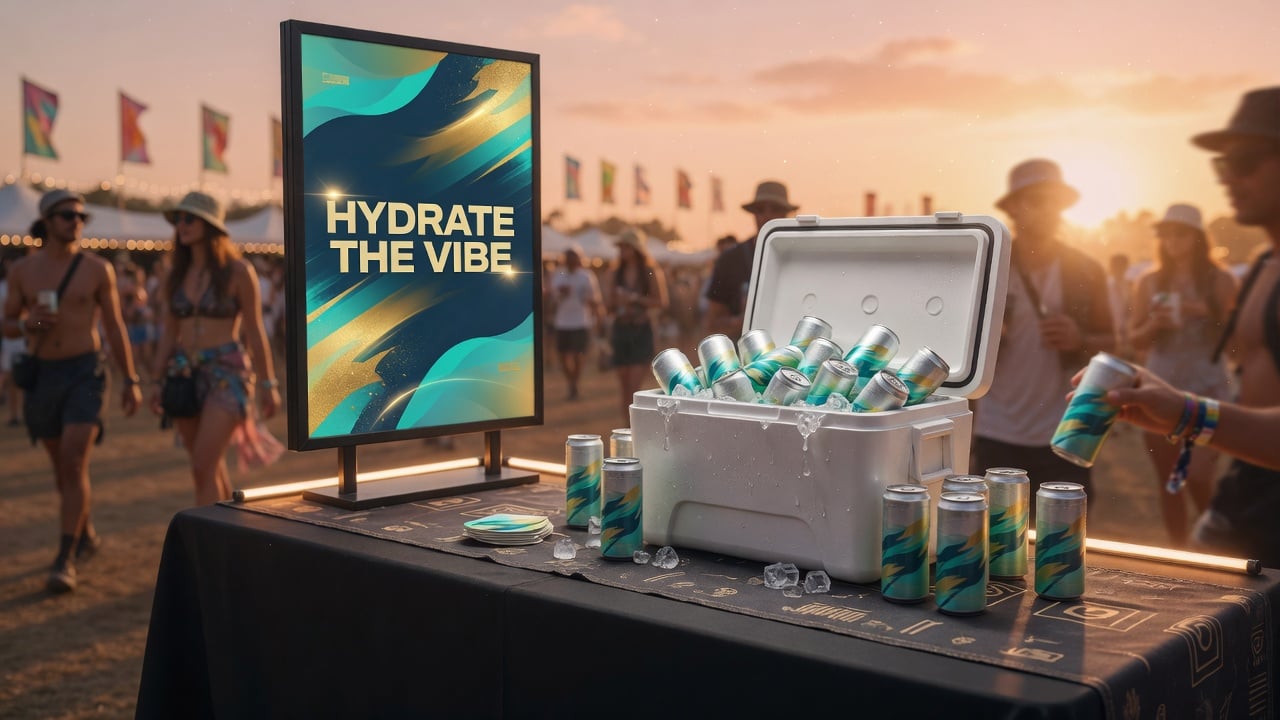
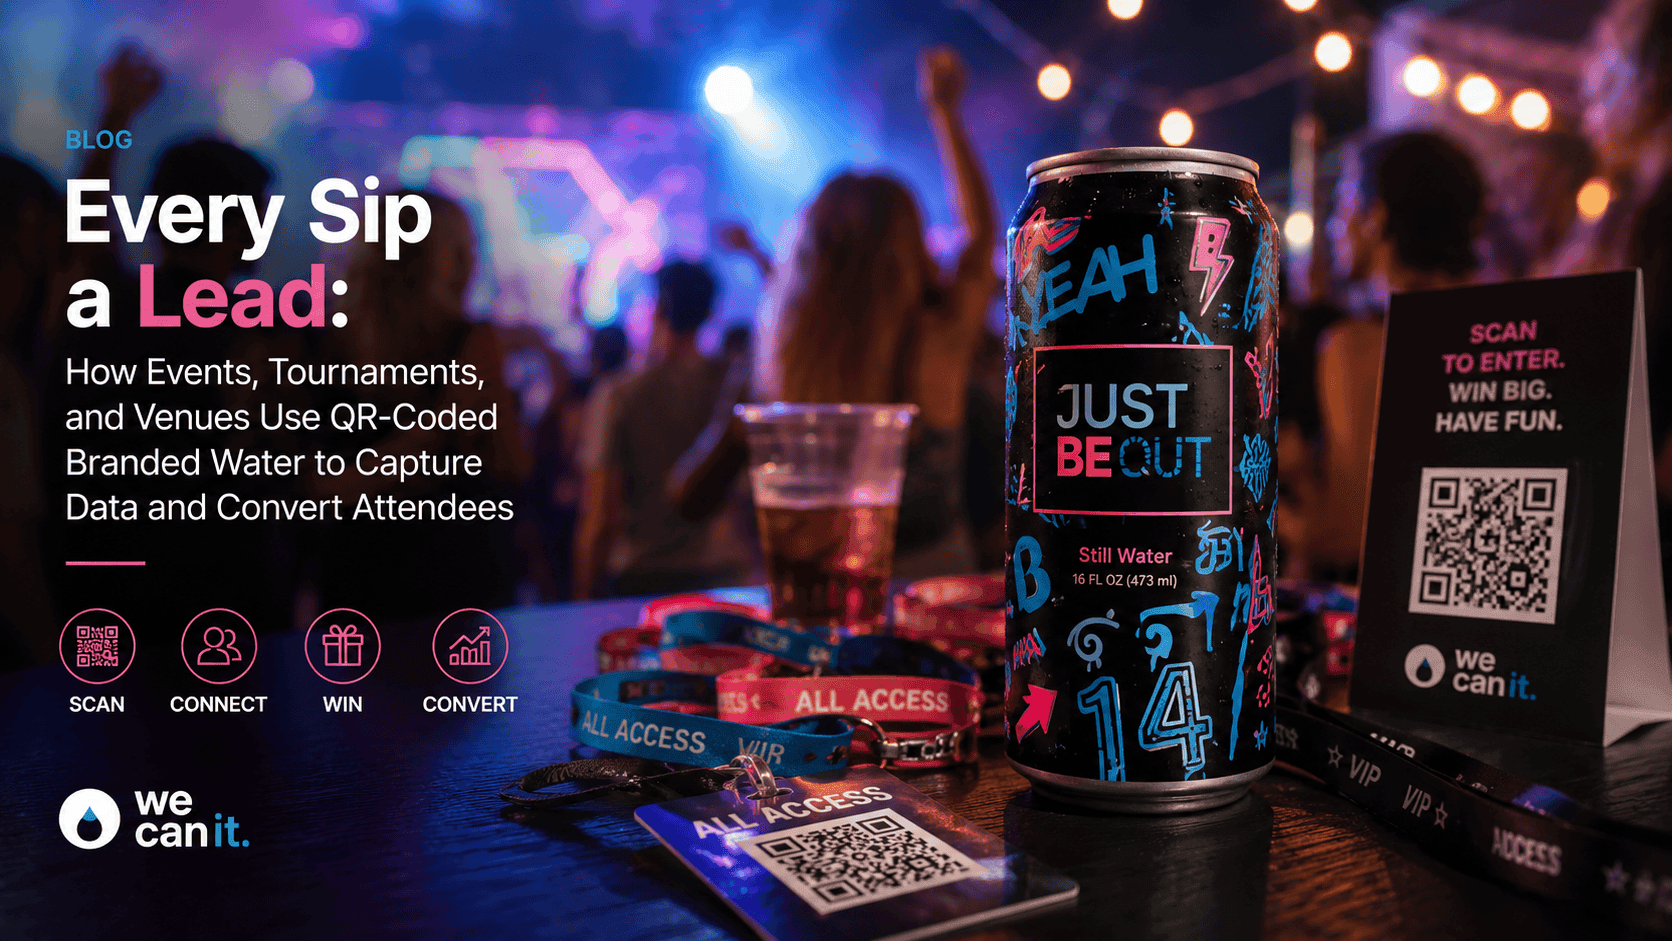
Activations are easy to love and hard to measure. The booth looked full. The cooler emptied. The photos looked sharp. Then someone asks what you learned, and the room goes quiet. Branded water with QR codes gives CMOs a physical object people already hold and a digital door you control. Market research starts when that door leads somewhere honest and measurable, not to a vanity scan count that dies in a slide.
Branded water QR analytics market research is not a slogan. It is a simple system: can in hand, scan, short journey, clean metrics, and a decision about the next reorder or campaign. This guide is for CMOs, brand experience leads, insights managers, and agency partners who want activations to produce first-party signal, not only vibes.
What is branded water QR analytics for market research?
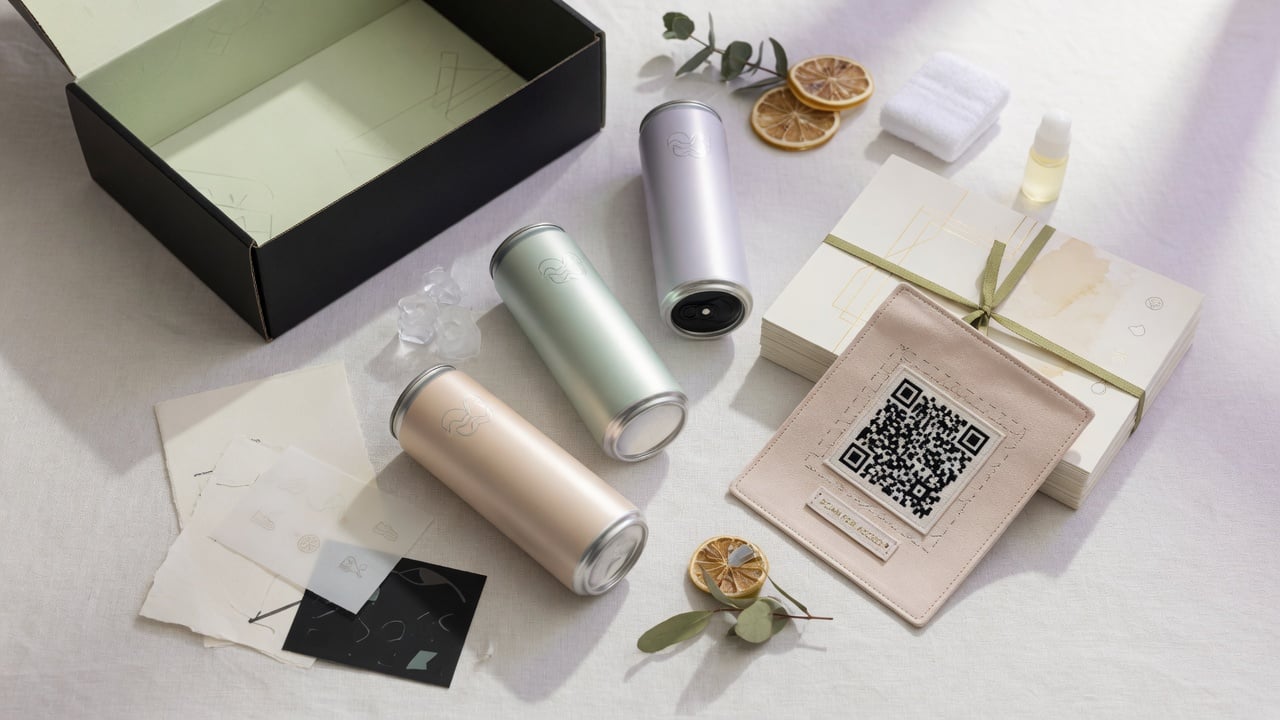
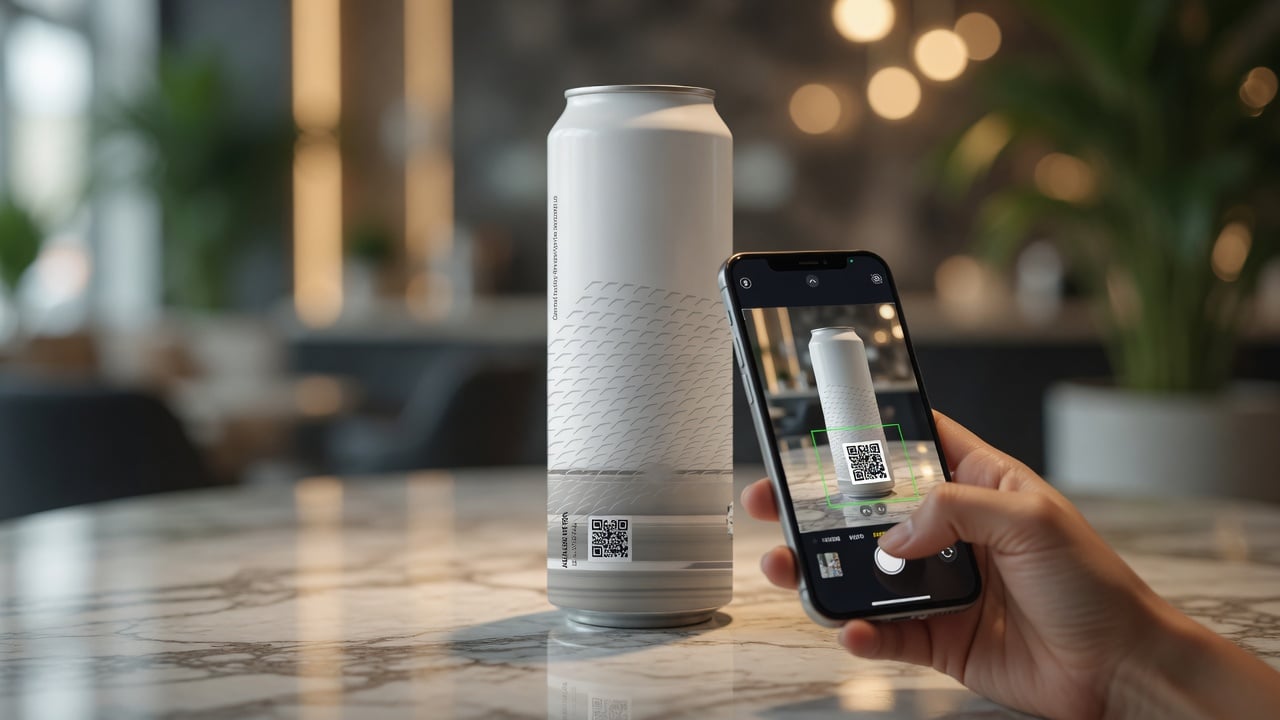
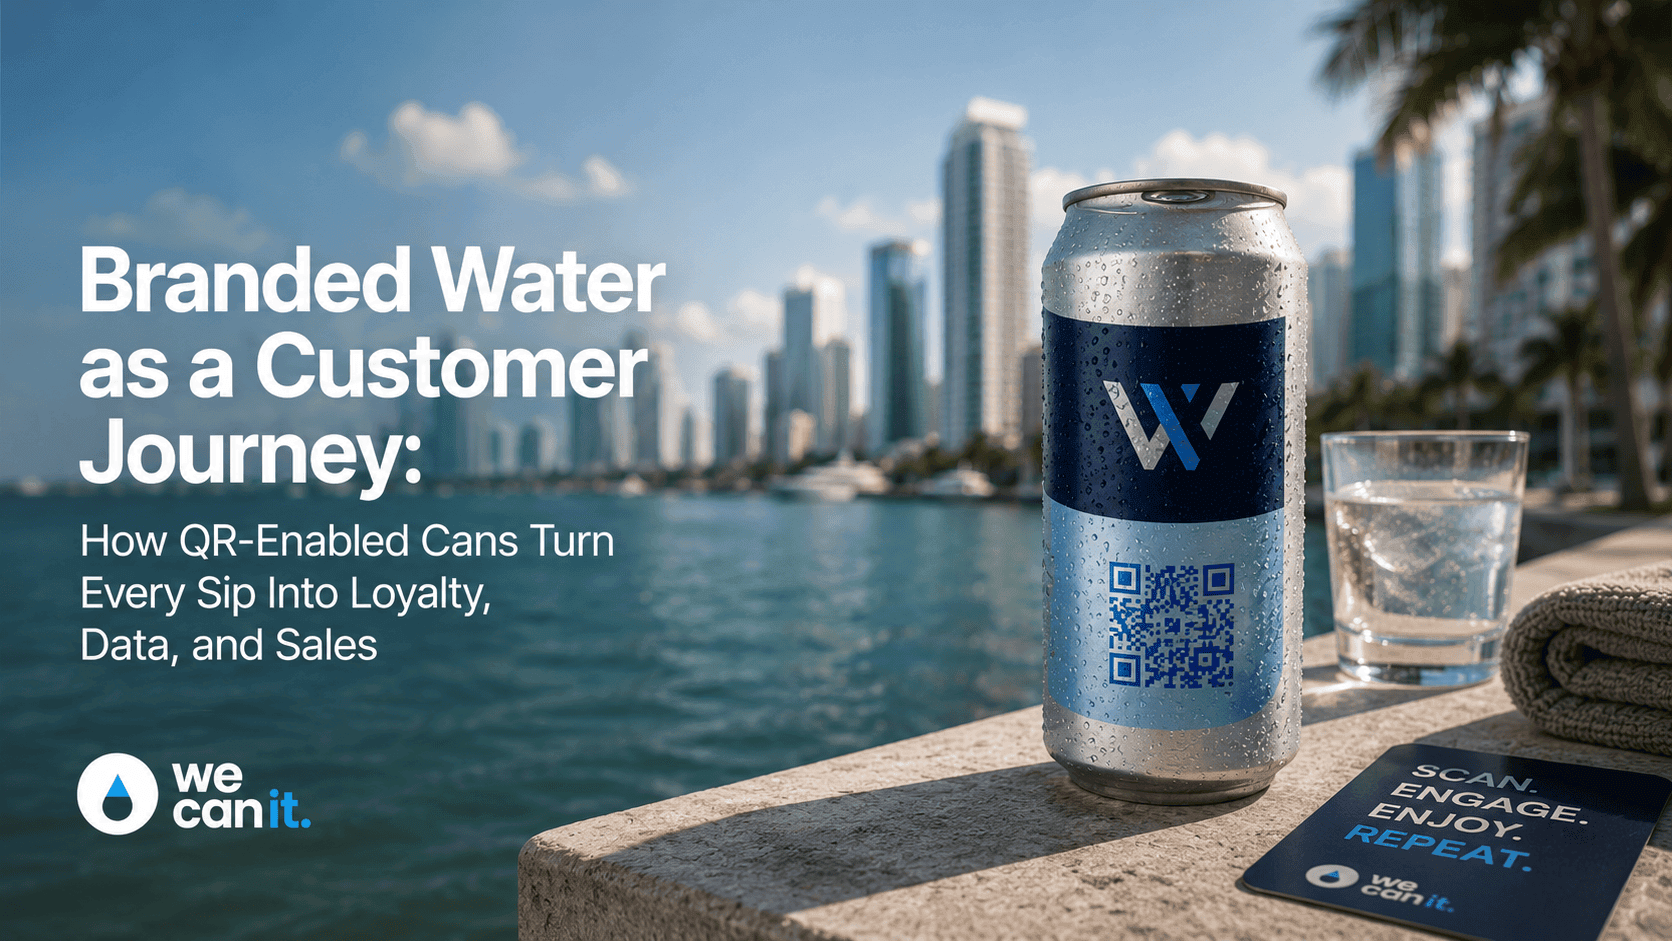
Branded water QR analytics for market research means private-label canned water carries a scannable code that opens a journey you design, then you measure scans, completions, and qualitative responses to improve the next activation. The can is the attention moment. The QR is the measurement instrument. The research value lives in the destination design and the data hygiene behind it.
Unlike a flyer left on a table, the can is chosen. Attention is higher at the point of thirst. That is why the same survey often performs better on a can than in a delayed email three days later when the weekend already feels far away.
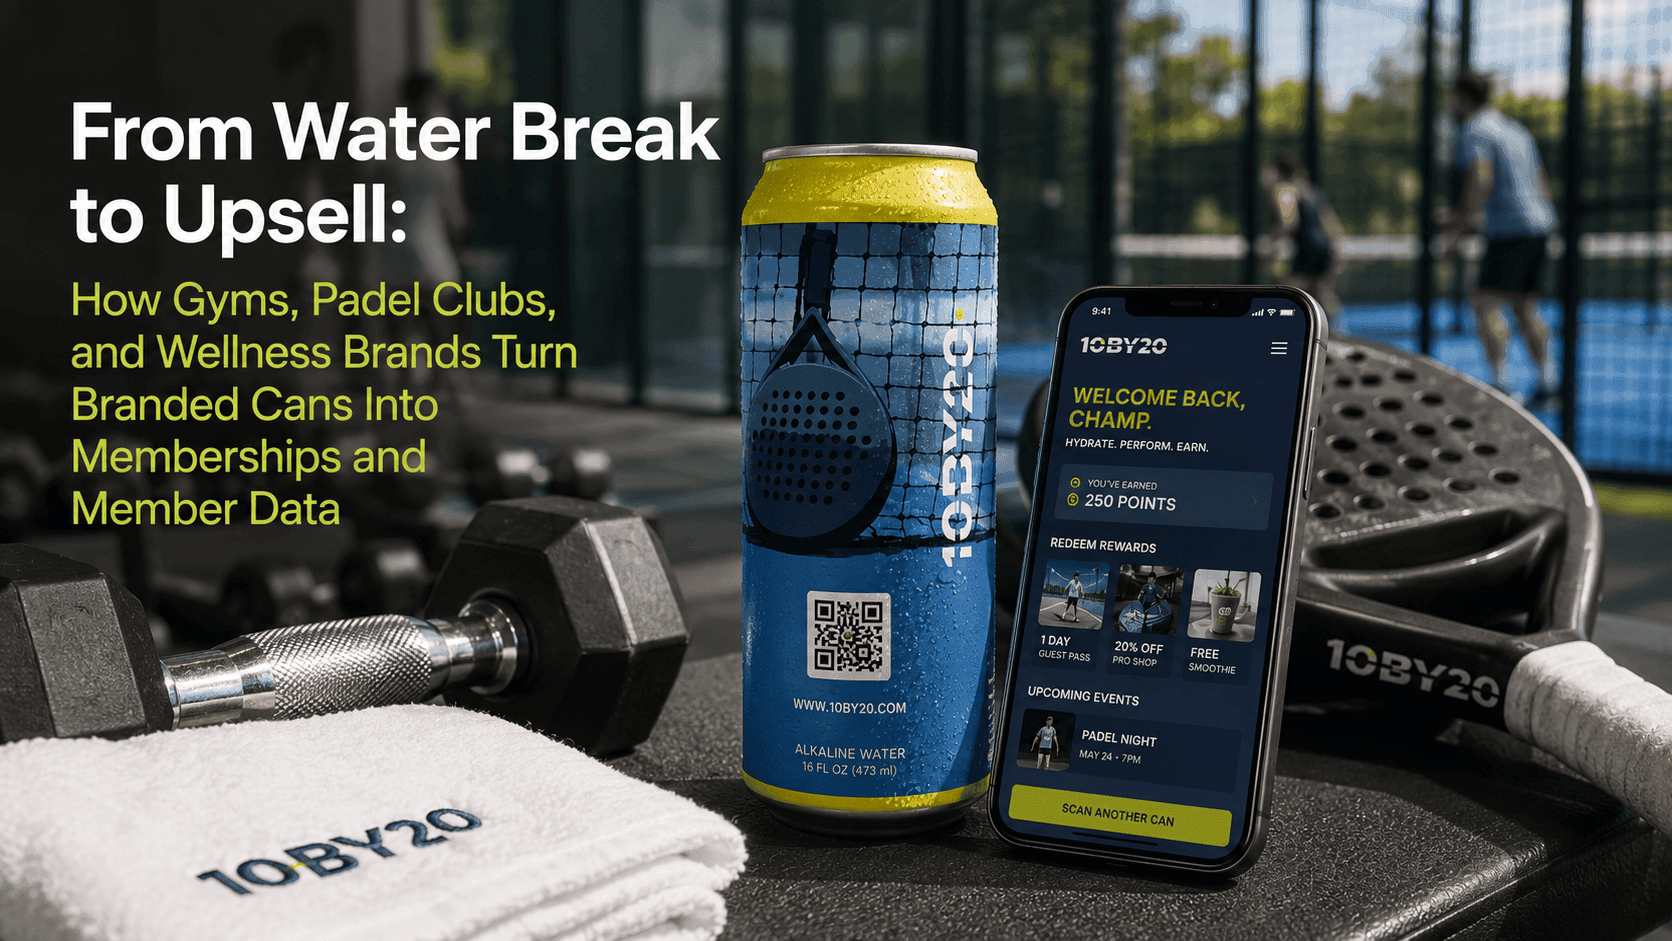
Scan counts alone are a weak story. CMOs need context about who scanned (even if identity is not required), what they completed, what they preferred, whether the signal improved a business decision, and whether the activation is worth repeating. Related reading: branded water with QR codes and QR loyalty strategies for fitness clubs.
What can you actually measure with QR on cans?
Core quantitative metrics
Start with metrics your tools can truly capture. Fake precision destroys insights credibility faster than missing data.
- Scan rate: scans divided by estimated cans distributed or opened
- Unique scans vs total scans when your tool supports it
- Completion rate: form, survey, or offer finish over scans
- Time to complete: drop-off if the journey is too long
- Destination performance by venue, SKU, or event day
- UTM or campaign tag performance when links are structured cleanly
Qualitative research you can collect ethically
One-question preference (location, flavor interest, next event interest), short NPS or CSAT after an experience, open comment for friction points, and consent-based email or SMS for follow-up research panels all work when privacy language is clear. Do not hide tracking. Trust is part of brand quality.
Do not claim foot-traffic models, heat maps, or demographic precision the QR tool cannot deliver. Measure what the stack truly captures.
How CMOs design a research-ready can journey
CMOs should design research-ready can journeys as short mobile paths with one primary job, clear consent, and tags that map back to venue and campaign. Lead with value the guest understands. Capture only fields you will use. Connect the destination to a system of record so insights and marketing share one truth.
A good journey feels like a favor, not a trap.
Journey patterns that produce usable research
Preference capture asks one thing you will act on: preferred venue, preferred time, product interest, or content theme. Store the answer with campaign tags.
Post-activation survey works while memory is fresh. Keep it under 60 seconds. Three closed questions plus one optional comment is enough for many events.
Offer with research secondary leads with a real offer (menu, class pack, listing brochure). Capture preference as a second optional step so research does not kill conversion.
Membership or loyalty join collects only the fields membership needs, then adds one preference field that insights requested in advance.
Content drop with feedback unlocks a video, lookbook, or trackside story, then asks one question about usefulness or next content.
How to tag cans for market research without chaos
Decide before print, not after load-in. Agree on one primary destination framework even if URLs differ by campaign. Set campaign IDs for event, city, or SKU. Align UTM structure with analytics. Write redirect rules if the offer expires. Build a fallback page if the campaign ends.
Do / Do not for research QR
Do:
- Test the QR on real phones before print
- Keep destination mobile-fast
- Align legal and privacy copy early
- Document who owns the data after the event
Do not:
- Print dead links
- Stack five goals on one form
- Change destination rules mid-event without logging why
- Share identifiable data without a clear purpose
Production facts that affect research timelines
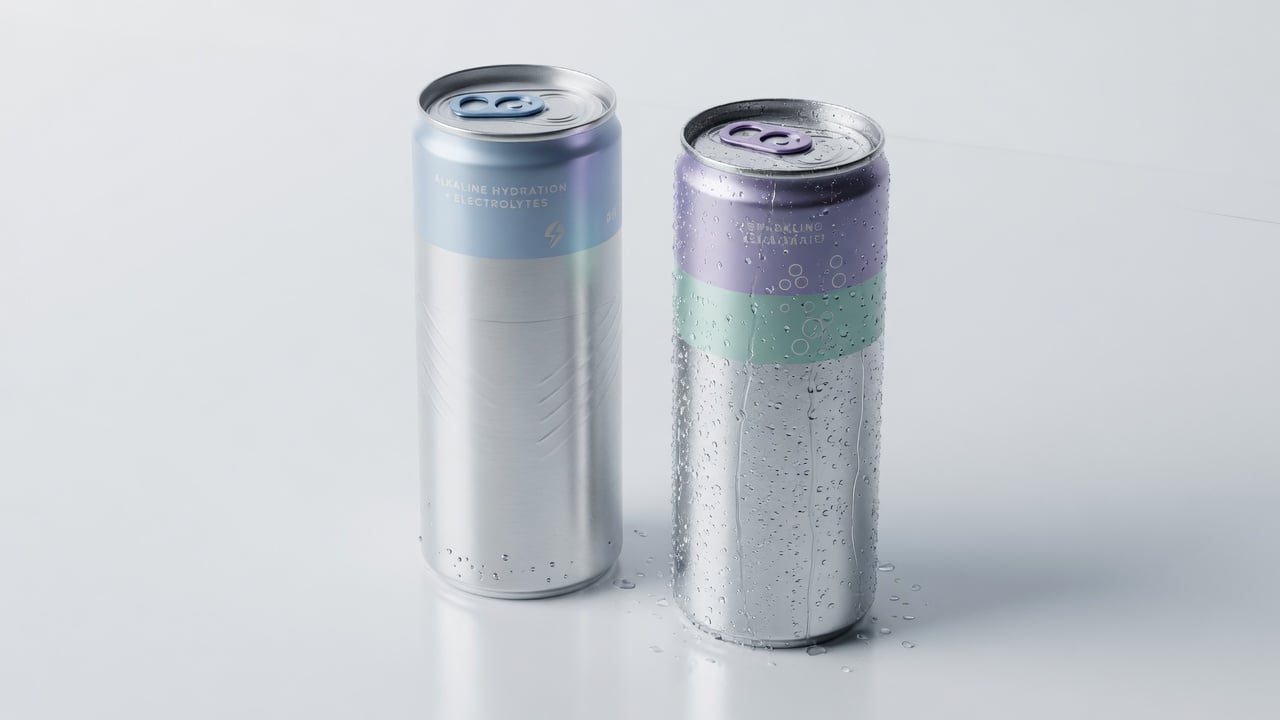
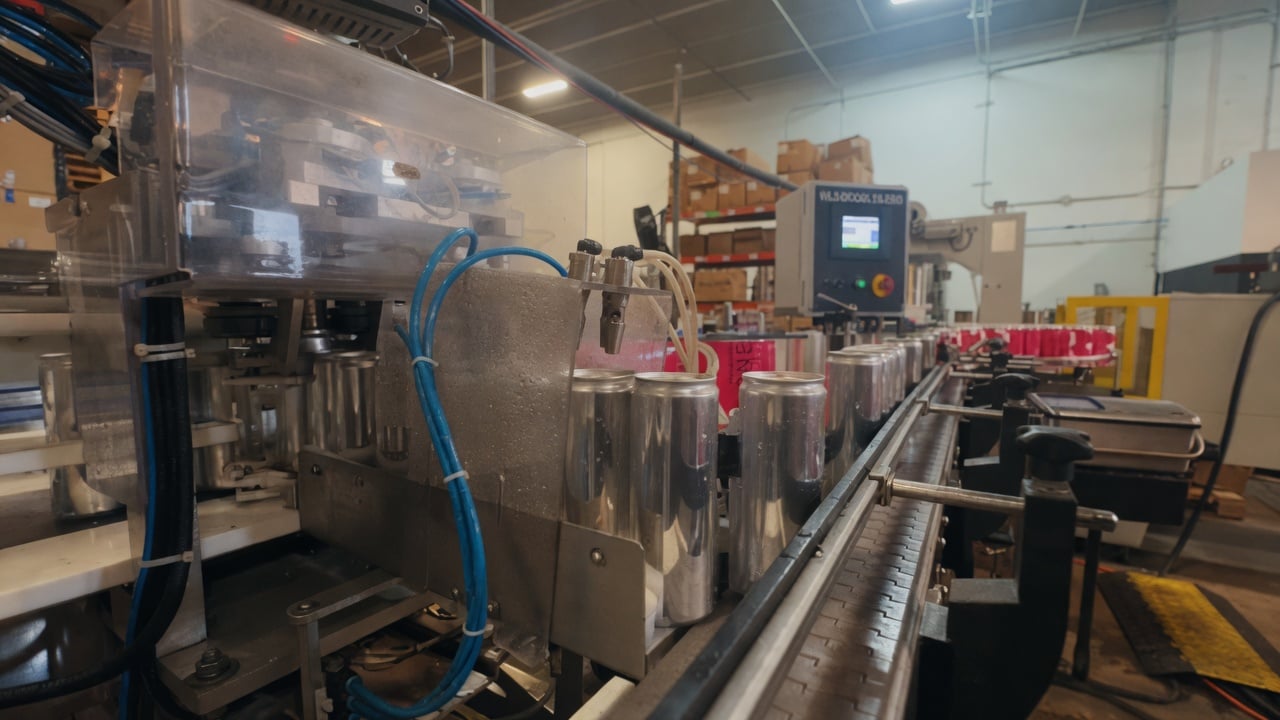
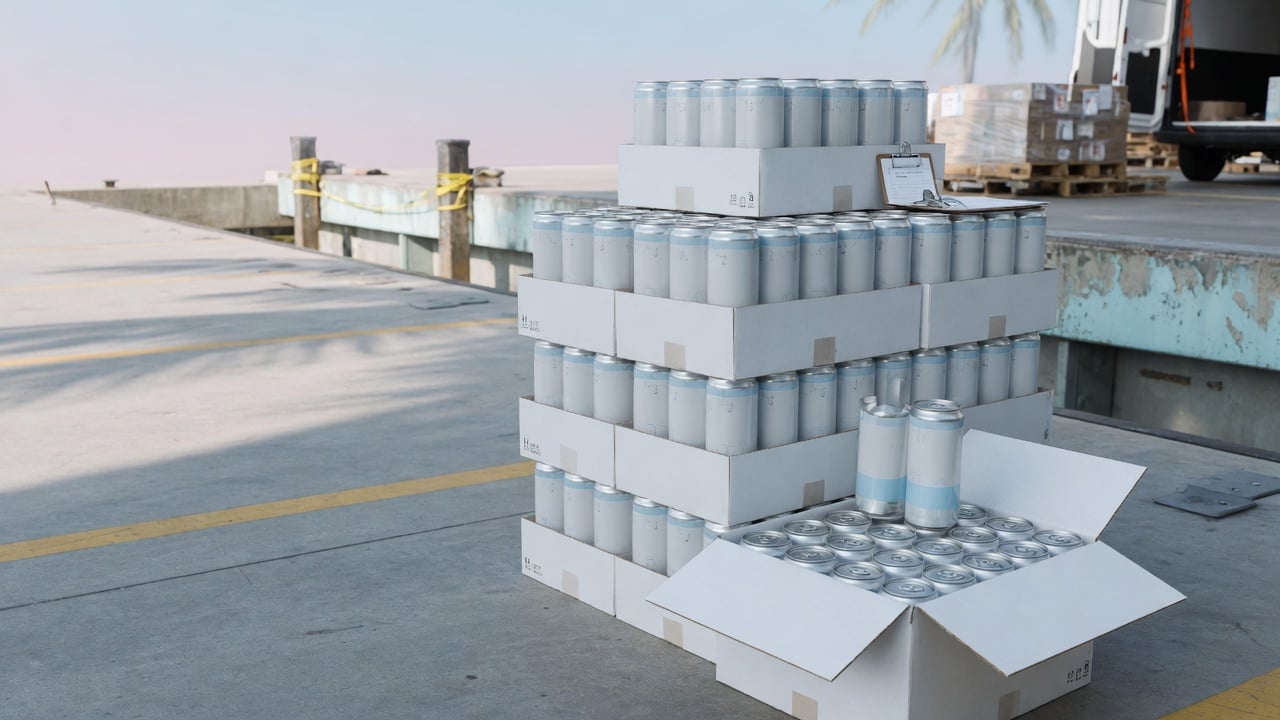
We Can It starts at 21 cases (504 cans) for label pilots. Digital print starts at 100 cases. Typical production is about 2 to 3 weeks from artwork approval. Water types include still, sparkling, and alkaline. Sizes include 12oz Regular, 12oz Sleek, and 16oz.
Research implications are practical. Lock journey URLs before art freeze. Pilot one venue before multi-city art complexity. Batch multi-SKU proofs if different QR destinations need different codes. Reverse-plan from the activation date, not the first brainstorm.
Our manufacturing and packaging process is described for you here: Technology · Water and Products. Digital journey context lives at Digital experience. Questions? Get a quote and a product advisor will email you quickly.
Who uses branded can QR for research and measurement?
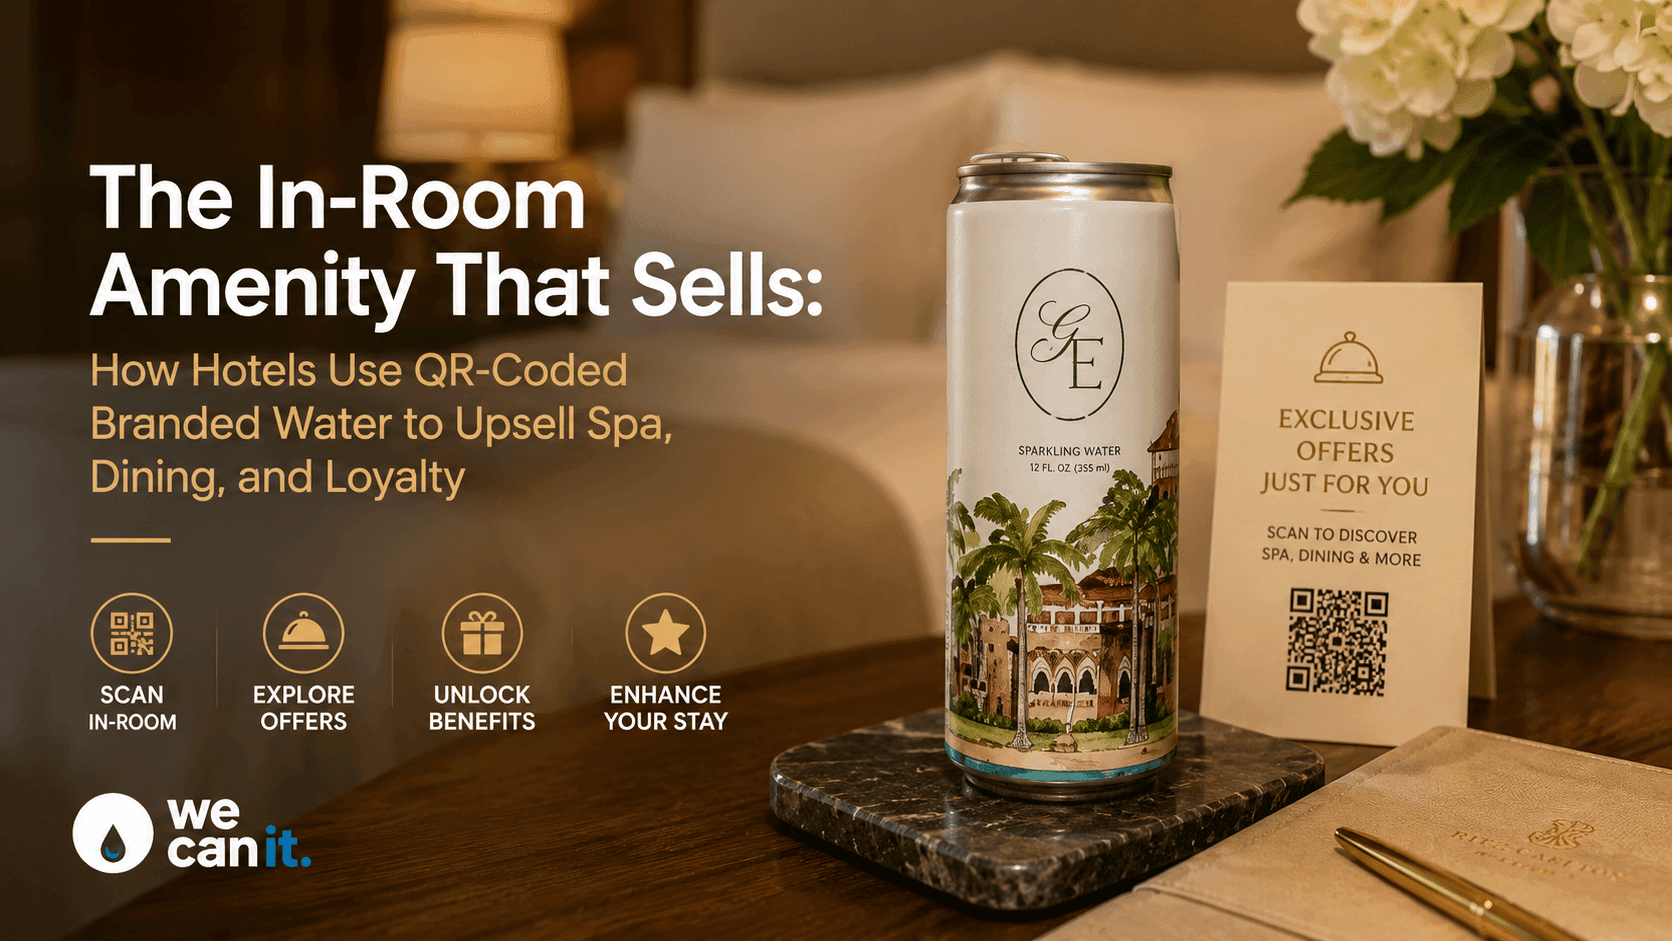
CMOs measuring brand activations and sponsorship hospitality, insights teams capturing preference at the point of experience, agency partners who need cleaner post-event reporting, fitness, hospitality, golf, marina, and real estate programs with live guest moments, and event marketers who want more than "the booth was busy" all share the same window. If the guest is thirsty and present, the research window is open.
Analytics operating model for the CMO office
Name humans for each role. Anonymous ownership is how QR destinations go stale.
Marketing owns campaign goal and creative. Insights owns survey design and analysis plan. Analytics owns tagging, dashboards, and quality checks. Ops owns can placement and restock counts. Legal or privacy owns consent language when needed. The manufacturer owns proofs, production, and ship windows.
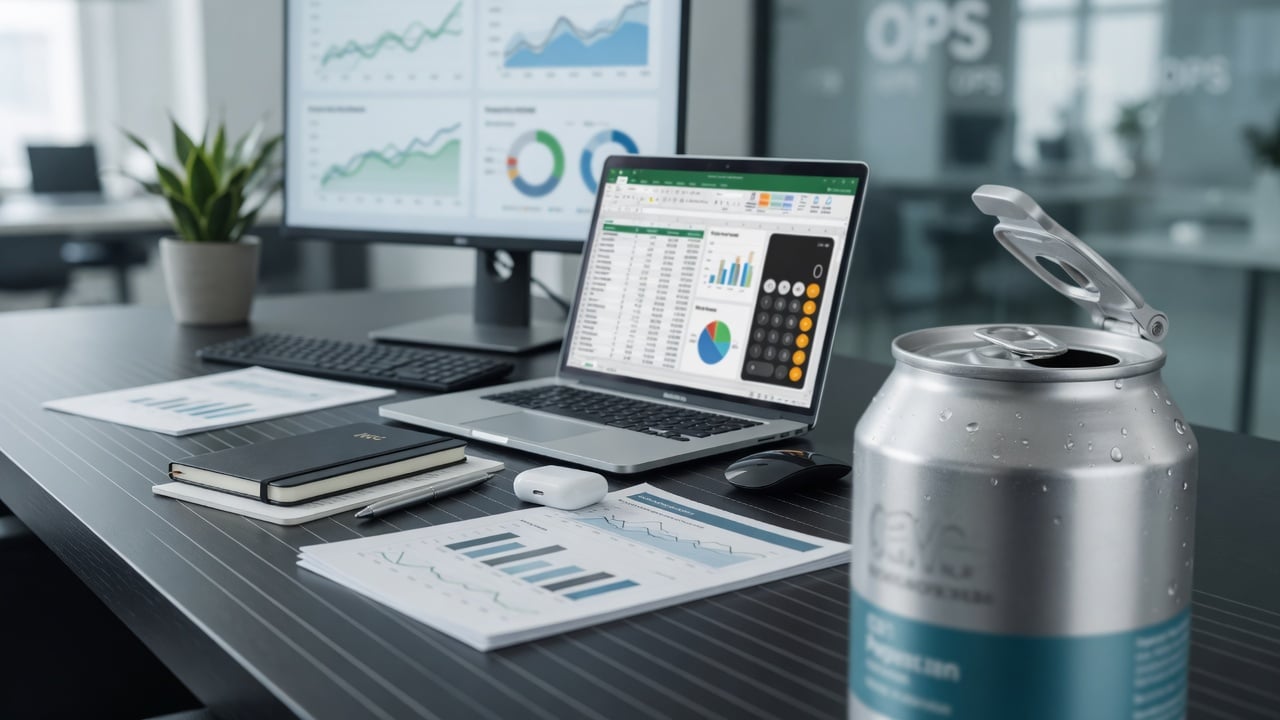
During the activation window, keep a simple weekly scorecard: scans by day and station, completions by journey, top qualitative themes, estimated cans out vs scans (directional), and an issues log for broken links, long load times, or staff confusion.
After the pilot, decide clearly: keep, fix, or kill the journey. Adjust station placement. Adjust question design. Reorder still volume first if the research SKU is secondary. Document what the board or brand team should stop asking so the next activation does not restart from vibes.
Pricing without fake list rates
Unit cost moves with case count, can size, print path, and water type. We do not invent unit prices here. Run the instant quote calculator with real inputs, then treat research design as a separate marketing workstream with its own tools and consent rules. The can is the distribution surface. The research stack is its own line of work.
Buyer checklist for QR analytics on branded cans
- Confirm the primary research or conversion job in one sentence.
- Confirm minimum order supports a pilot (21 cases / 504 cans).
- Confirm lead time from artwork approval (about 2 to 3 weeks typical).
- Confirm QR destinations are live and mobile-fast before print.
- Confirm tagging and UTM rules with analytics.
- Confirm privacy and consent language.
- Confirm who owns data after the event.
- Confirm station map and estimated can counts for scan-rate math.
- Confirm staff scripts for guest questions.
- Confirm reorder owner and insights read-out date.
Common failure modes (and fixes)
Vanity scans only get fixed with completion metrics and decision rules. Long forms get fixed with one primary job and optional extras. Dead QR after the event gets fixed with evergreen redirects. No can count baseline gets fixed with station inventory logs. Insights locked out of planning gets fixed with a joint brief before art. Too many SKU URLs get fixed with a destination framework and campaign tags.
What the two weeks before art lock look like
Day 1 to 2: Align research question, success metric, and activation date. Day 3 to 4: Journey build, tagging, privacy copy, and can art in the same thread. Day 5: Proof approval, URL freeze, quote lock. Then production: Typical window is about 2 to 3 weeks from approval. Pad for freight. Activation days: Place cans, log inventory, monitor live. Within 5 business days after: Insights read-out and reorder decision.
If the date cannot fit that window, change the date or the scope. Do not print a research tool with a destination that is still "almost ready."
What good looks like after 90 days
Ninety days in, you should have at least one journey with completion metrics leadership trusts, clear station-level learning about where cans and scans concentrate, a documented decision the data changed (offer, creative, venue, or reorder), staff who can explain the scan in one sentence, a reorder placed without redesign panic, and a privacy and tagging process that can scale to the next activation. That is the bar for branded water QR analytics market research.
FAQ
Can we pilot branded water with QR without a 10,000-unit minimum?
Yes. We Can It starts at 21 cases (504 cans). That is built for single-activation research pilots.
How long does production take?
About 2 to 3 weeks from artwork approval is typical. Freeze QR destinations before art approval.
What should CMOs measure first?
Scan rate, completion rate, and one qualitative theme. Add sophistication after the basics are clean.
Do different events need different can art?
Not always. Many teams keep one brand wrap and change destination tags by event. Separate art is a separate SKU when creative truly differs.
Where can we learn more about QR journeys?
Start with branded water with QR codes and digital experience.
Does We Can It ship outside Florida?
Yes. Production is in Miami. Cases ship nationwide across the US.
Get branded water QR analytics for market research
Ready to make activations measurable with cans people actually hold?